


Hello, and welcome back. Jessie here, back from the very last week of outdoor sports for the year, with my fast-pitch, slo-pitch and three-pitch leagues wrapping up (😭). It’s officially the offseason, also known as the hard pivot to crafting.
This week: Google Search Console — again! In recent years, Google released several updates to it free toolSearch Console, used to track, monitor and improve your site’s performance across the Search ecosystem. We updated our GSC primer, with fresh notes on social platform tracking and AI impressions for Discover and Search. Plus: tips from our fall community call!
Thanks to Trisolute News Dashboard for making our community call possible — and to Barry Adams for sharing his insights on making the most of GSC’s many technical reports. Watch the video recap here or peep the notes. What should we cover next?

Let’s get it.
THE 101
What is Google Search Console?
Google Search Console (GSC) is a free tool that helps monitor and improve your site’s presence in Google’s search ecosystems.
It includes reports on your content’s performance in Google Search, Discover and News, alongside technical reports on the infrastructure of your site, including Core Web Vitals, or the crawl status of pages. Recent updates provide data on AI impressions, and reporting on the queries that led people on Google to your social content.
Once you have access to GSC (more on that here) there’s a wealth of information to be gleaned.
However, there are limitations with the data: it’s only a 16-month window, there’s accuracy issues due to data bundling and privacy protections (it hides low-volume or unique long-tail queries), and only 1,000 rows of data can be exported easily (there are workarounds using Google’s API or Looker). SEO and audience editors should properly caveat their reporting.
Overall, it’s best to treat GSC data as directional, focusing on patterns and performance trends rather than concrete numbers.
THE HOW TO
The Overview and Insights Performance reports
What it is: The Performance and Insights reports provide a topline view of your site’s overall performance on Search results and Discover.
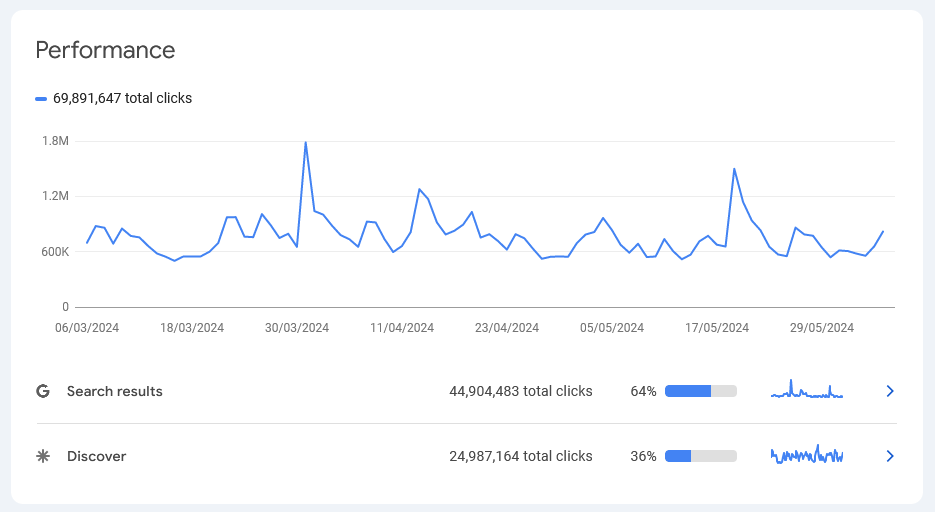
In the Insight tab, there are key stats like top countries, the share of branded vs. non-branded traffic, and additional traffic sources (i.e., News search or video).
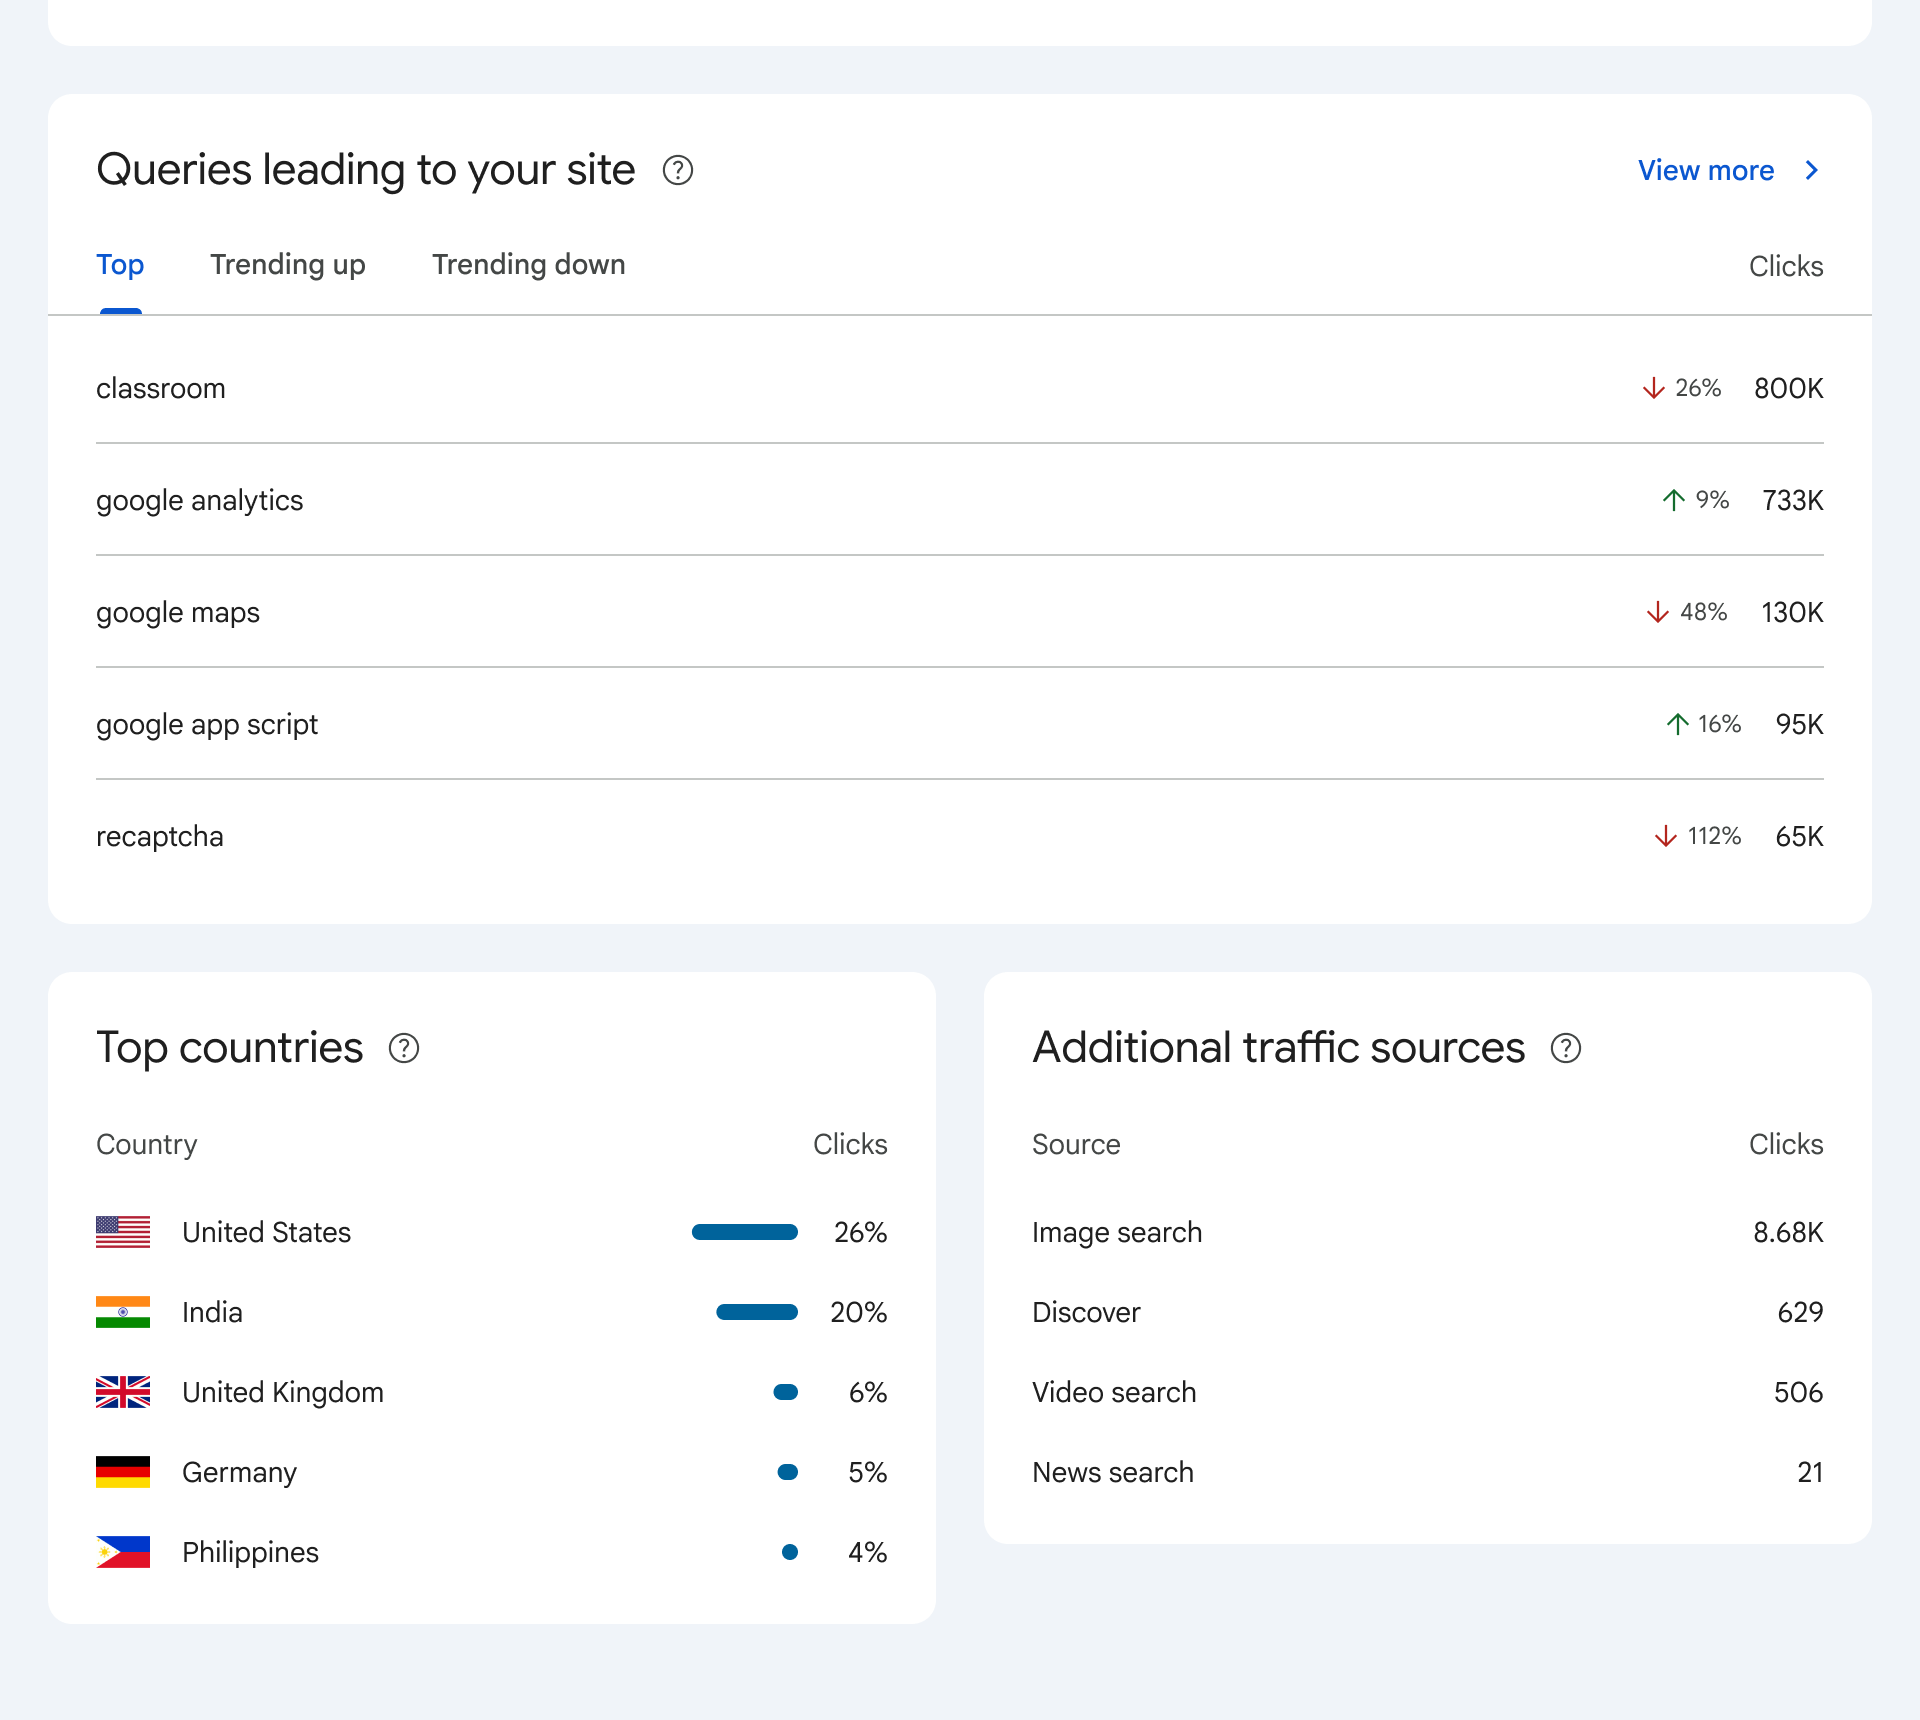
What it can do: Overview and Insights are helpful snapshots, providing a trendline of your general performance on search.
“Queries leading to your site” groups similar queries together (i.e., “news” might contain specific terms like “news today,” “breaking news” and “latest headlines”), and are categorized as top, trending up and trending down, making it easier to spot the trend.
Performance on Search results report
What it is: An overview of your site’s performance in Search (including generative AI). It includes filters for time range and search types, to help narrow down the data by query, page, country and more.
There is also a Generative AI sub-report for Search.
You can track four key metrics for these filters in the Performance report:
Clicks: How many times users clicked your site’s content;
Impressions: How often your site was displayed;
Average click-through rate (CTR): Clicks over impressions;
Average position: Your site’s average position in search results.
Reporting can be viewed on several timescales — from as little as the last 24 hours (excellent for breaking news), up to 16 months (useful for measuring year-over-year performance) or with various date range comparisons like the last 28 days year-over-year.
What insights can you glean?
Your site’s recent and historical performance. Time filters allow for reporting on recent and historical performance, while Compare allows editors to contrast periods (i.e., the last three months versus the previous period, or prior year). Custom filtering allows for even more specificity.
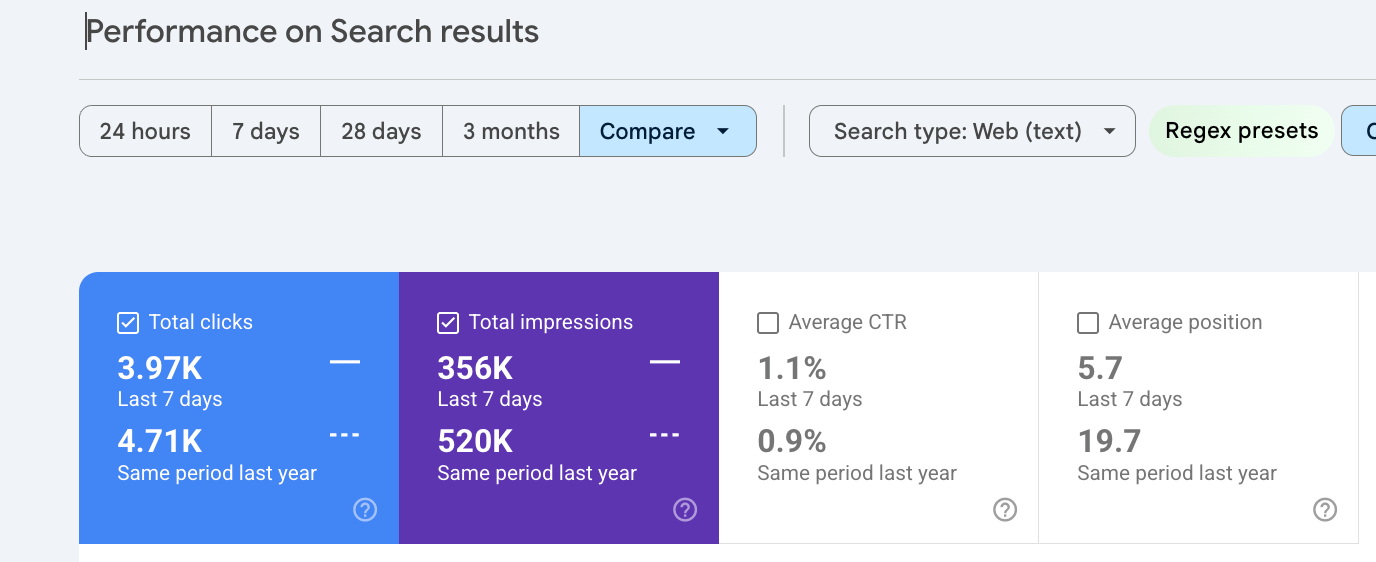
The date range filters — for the last 24 hours to three months, or longer 6- to 16-month periods — along with period-over-period reporting allow editors to measure performance over time. Is your content earning more clicks (compared to last year)? Are you ranking higher, on average, than the same period last year?
🔥 Pro tip: GSC Calculations automatically calculate and display percentage changes in GSC.
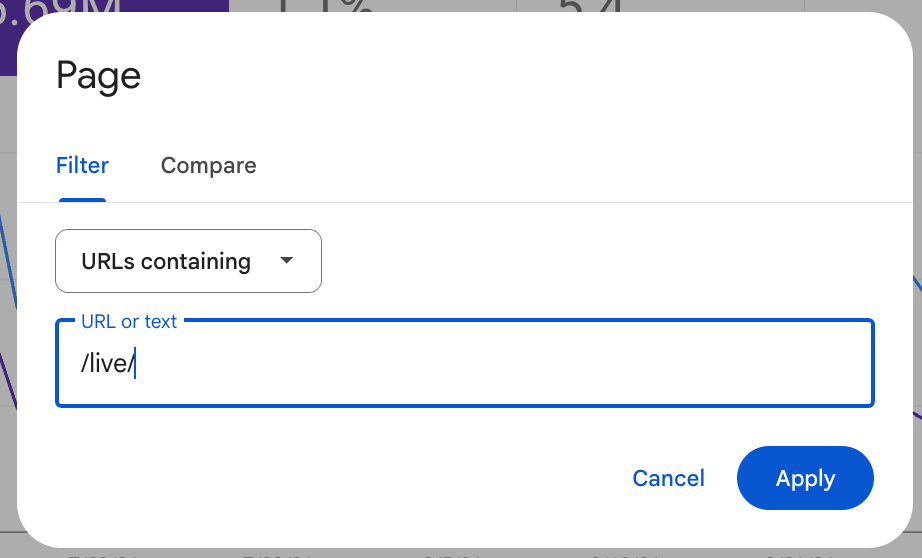
Your site’s key page formats. Using the Page filters, refine your dataset to see all pages with a certain URL string/parameter (i.e., “/live/” for blog or “/topic/” for tag pages). See the queries that rank for this type of content (along with clicks, etc.), and the specific URLs earning visibility on Google.
Your site’s key queries. Using the Query filter, refine your dataset to look at pages that rank for specific terms (use Queries containing to look at topics or figures — “trump” or “black friday” or “news”).
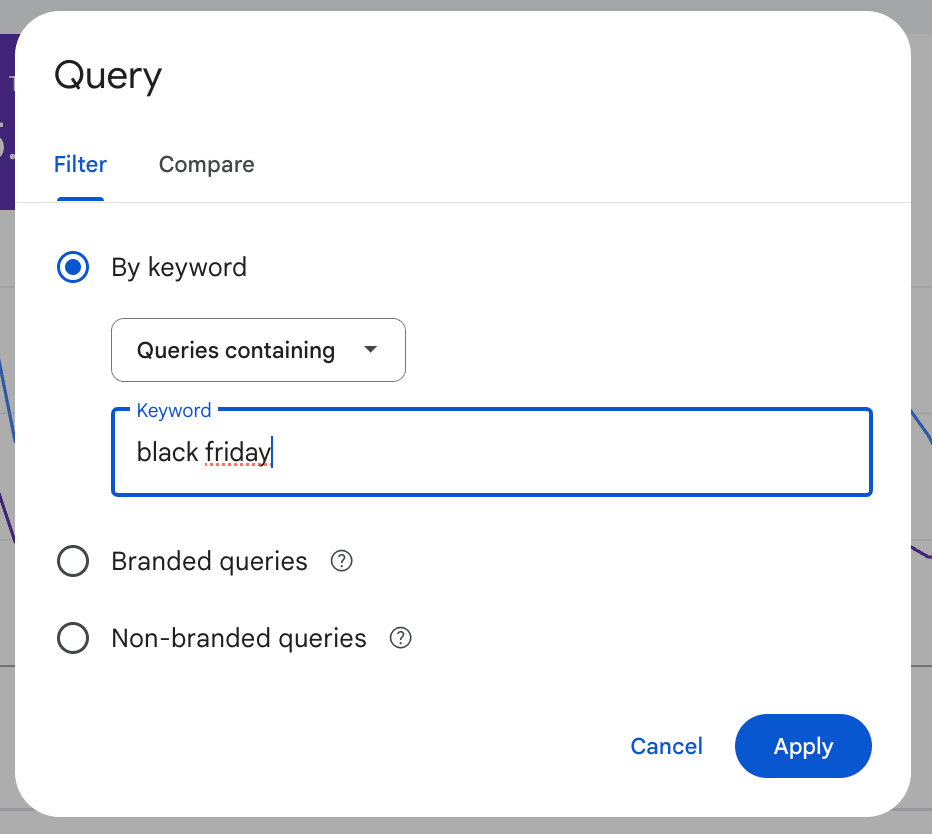
Regex (while sometimes finicky to write) allows for more granularity.
🔥 Pro tip: The Better Regex in Search Console Chrome extension has preset regex functions: from URLs containing a parameter to queries with Transactional intent. The extension can also save custom queries.
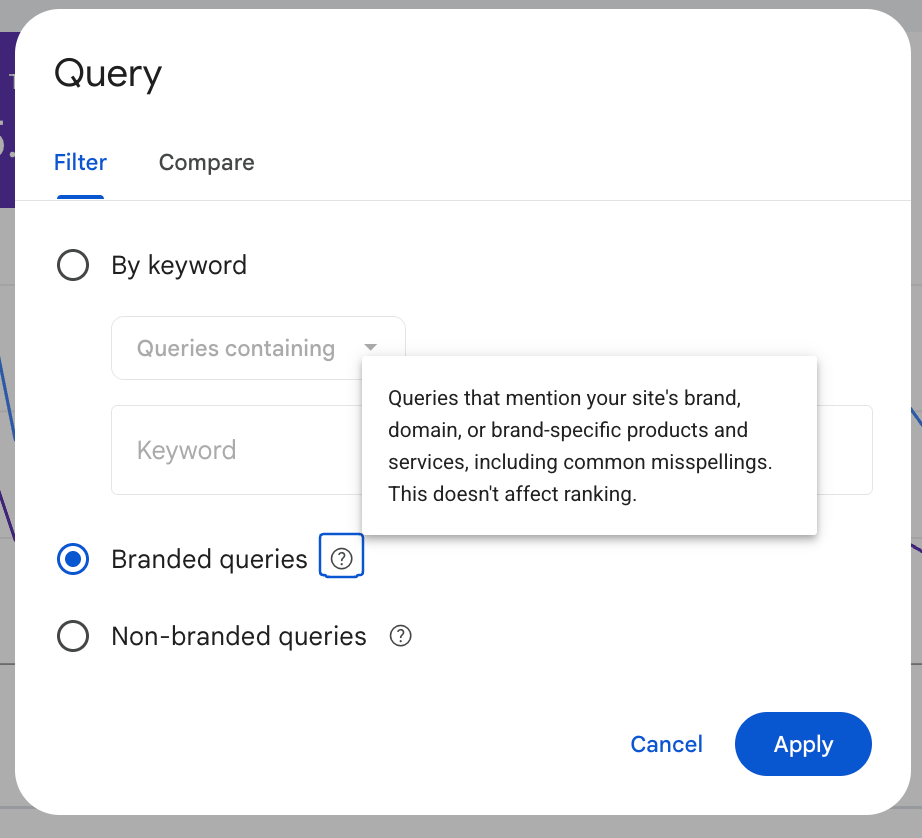
Your site’s branded search health. Under the Query filter, the Branded filter shows terms mentioning your brand, domain, or brand-specific products and services (including common misspellings), as determined by Google’s AI.
Branded searches can be a proxy for user loyalty, and can reveal what topics or formats are closely associated with your publication.
Terms like “Guardian football” or “NYT spelling bee” are searches associated with coverage areas or editorial tools; tracking this data tells you if you have a growing loyal audience.
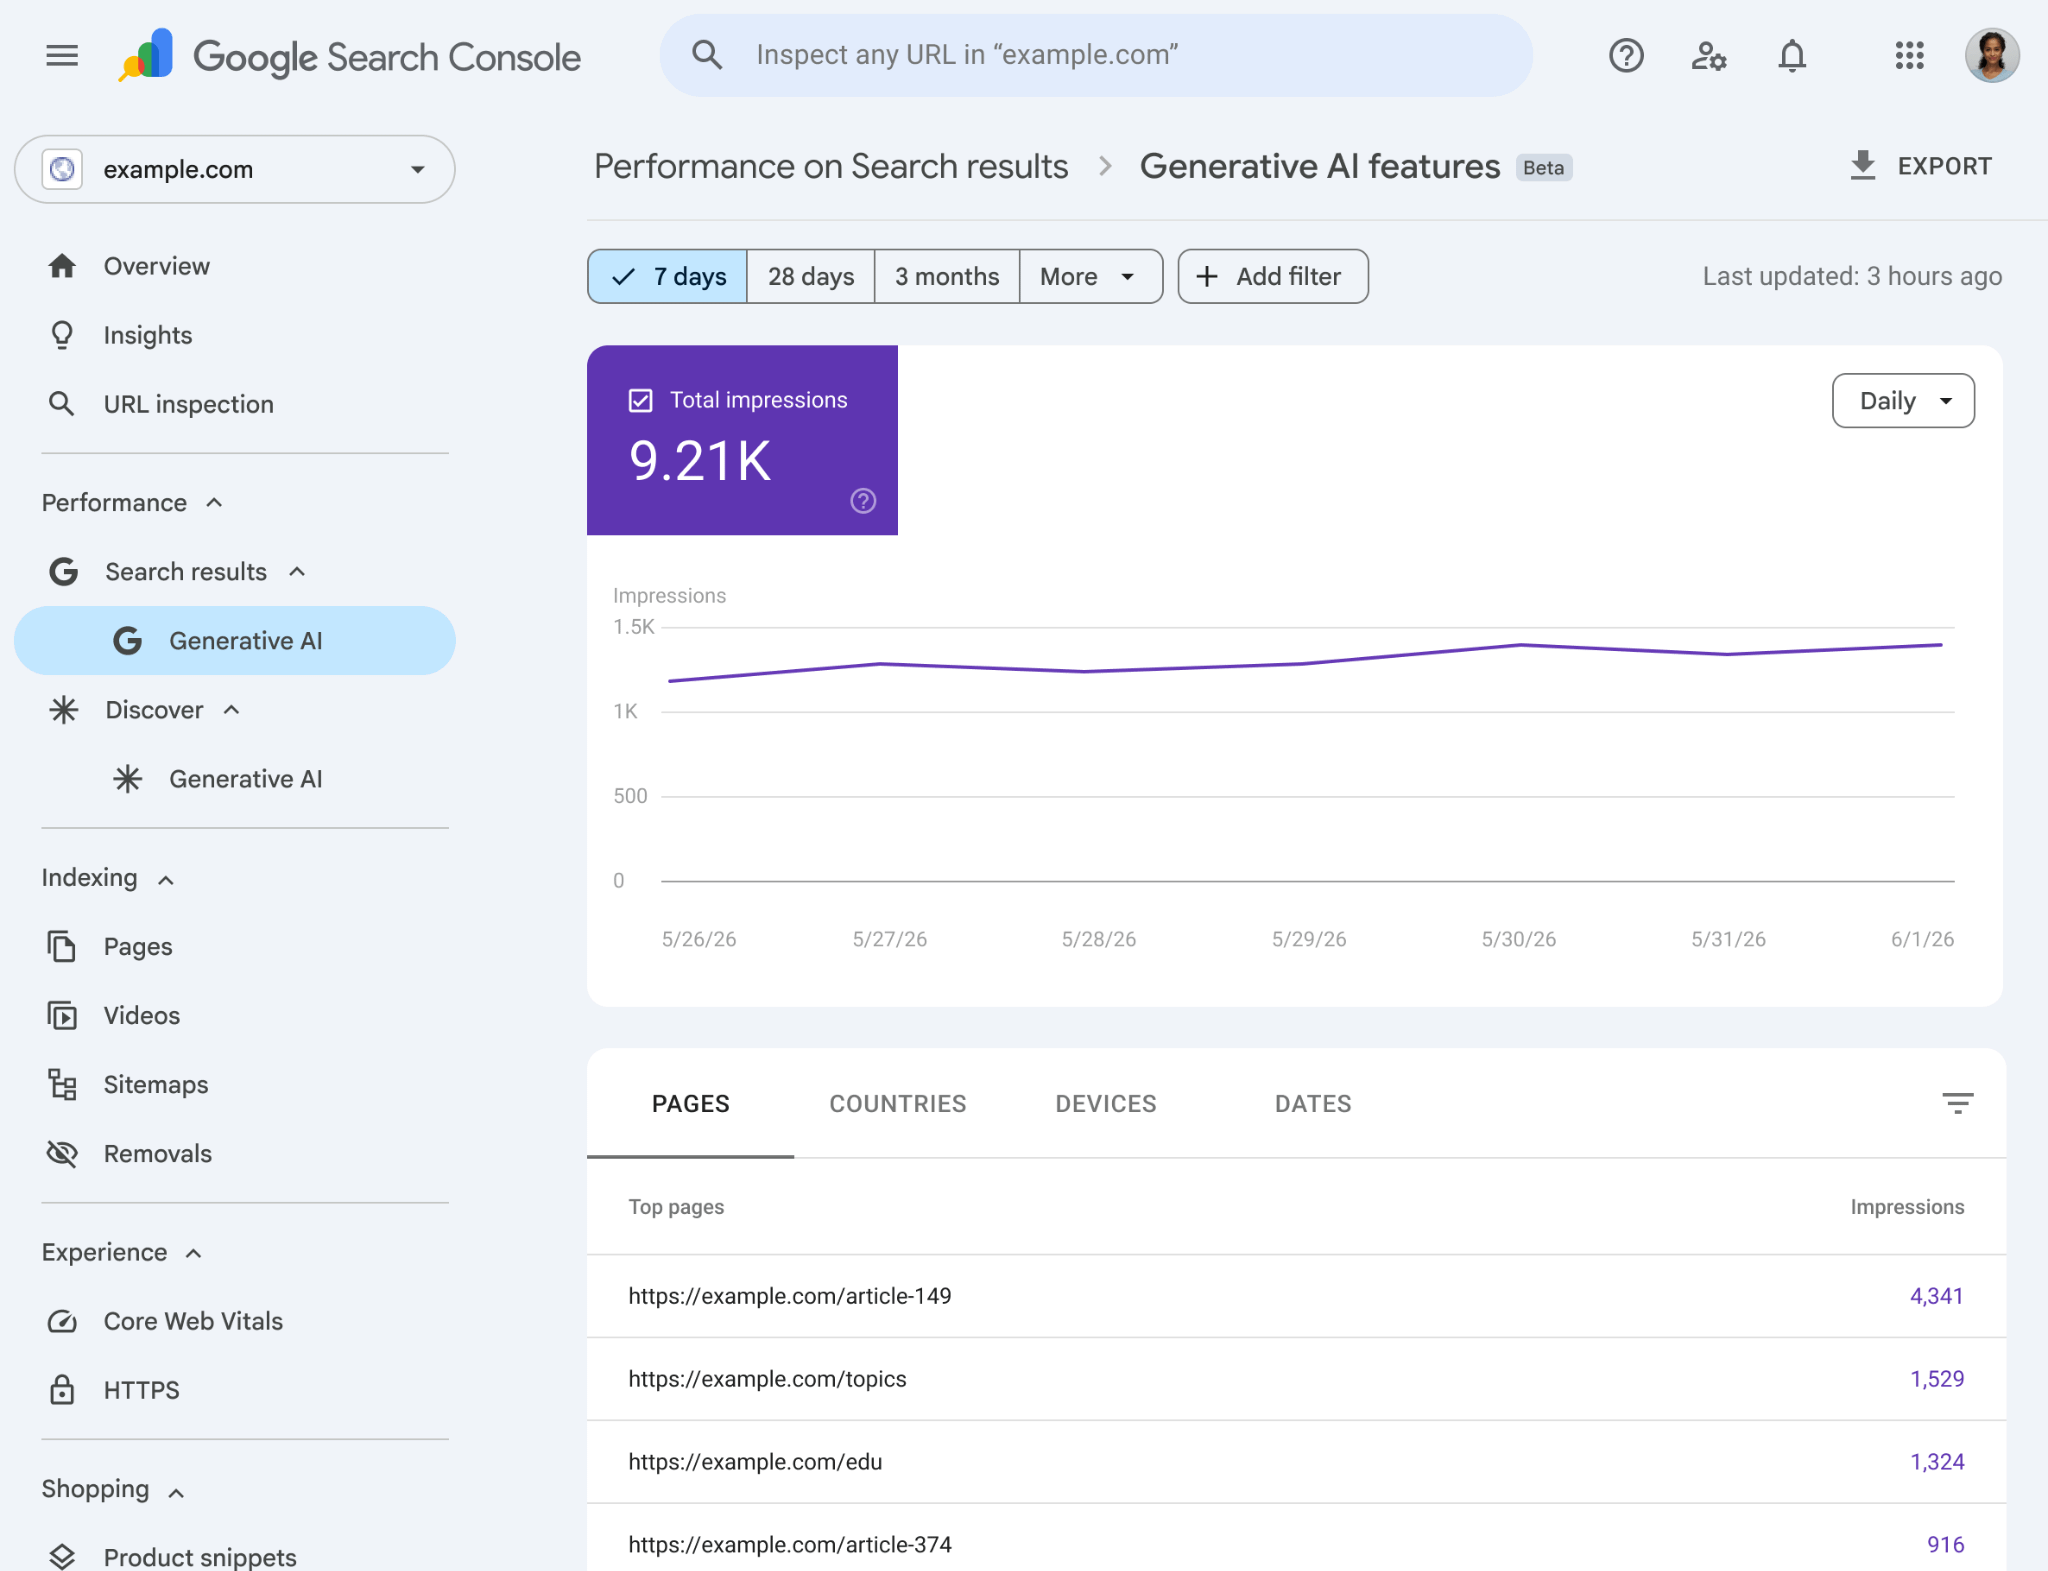
What AI data is available? Impressions. The new Generative AI sub-report only includes impressions.
It’s possible this will change soon; as part of the U.K.’s CMA ruling, Google must provide publishers with “clear and detailed metrics on user engagement with their search content in search generative AI features.” It’s likely this will include clicks globally.
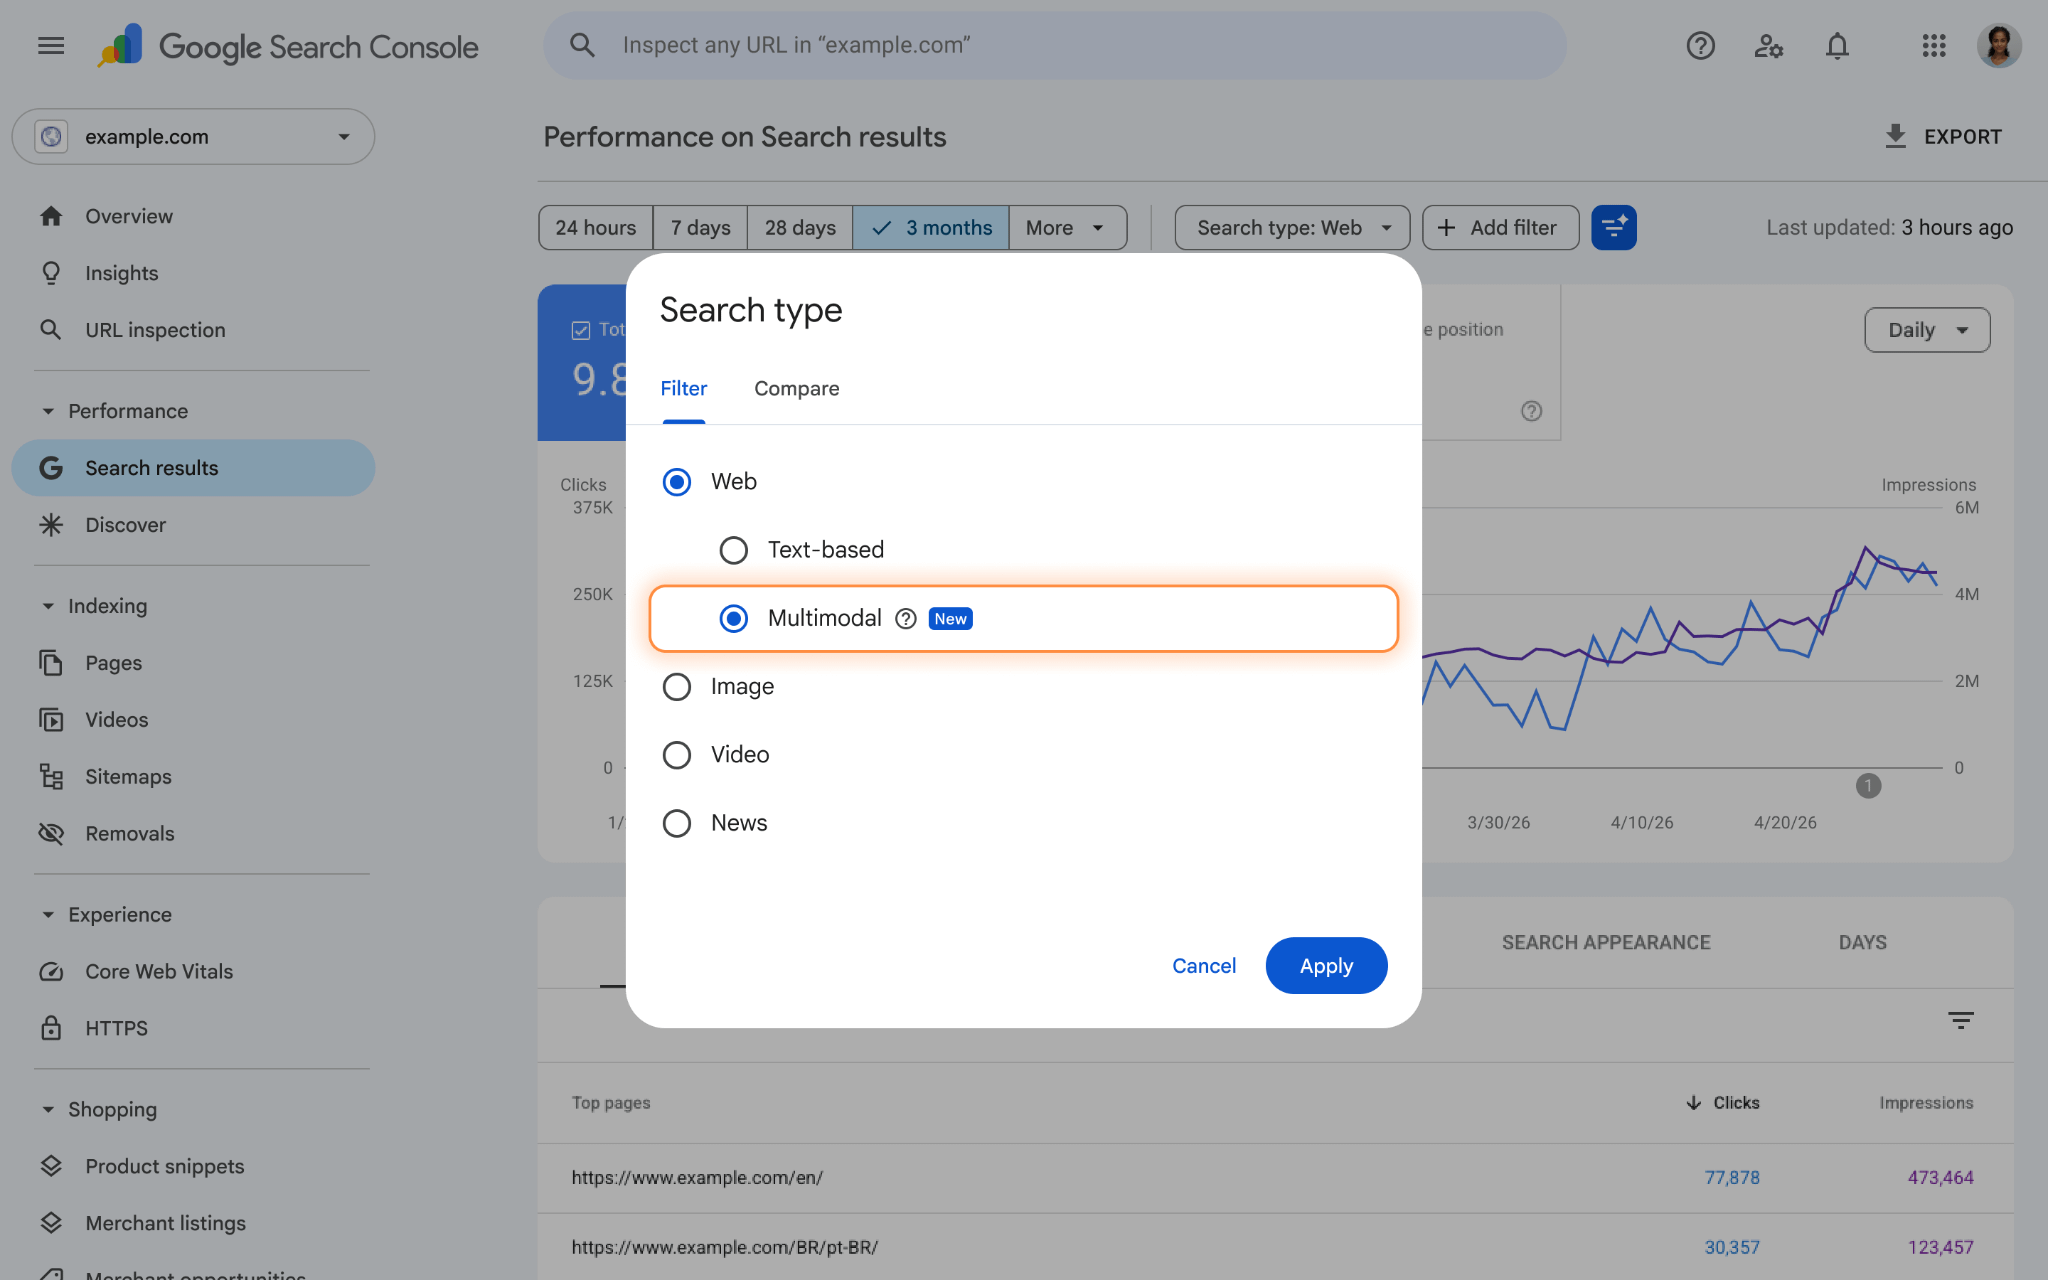
What other data is available? Google launched a filter in September splitting Text-based and Multimodal searches. It enables publishers to see searches done via Google Lens, images uploaded to Search or the “Search this image” feature led to their pages.
Why it matters: Performance reporting for Search is an essential part of understanding your overall performance on Google. Use the built-in dimensions and filters to refine your dataset for more useful reporting (and expert the filtered data to Google Sheets or as a CSV for further analysis).
Performance report for Discover
What it is: A report on key metrics about your site’s performance on Discover. It tracks total clicks, impressions and click-through rate (CTR), as well as page-level performance for URLs featured in Discover feed.
There is also a Generative AI sub-report for Discover.
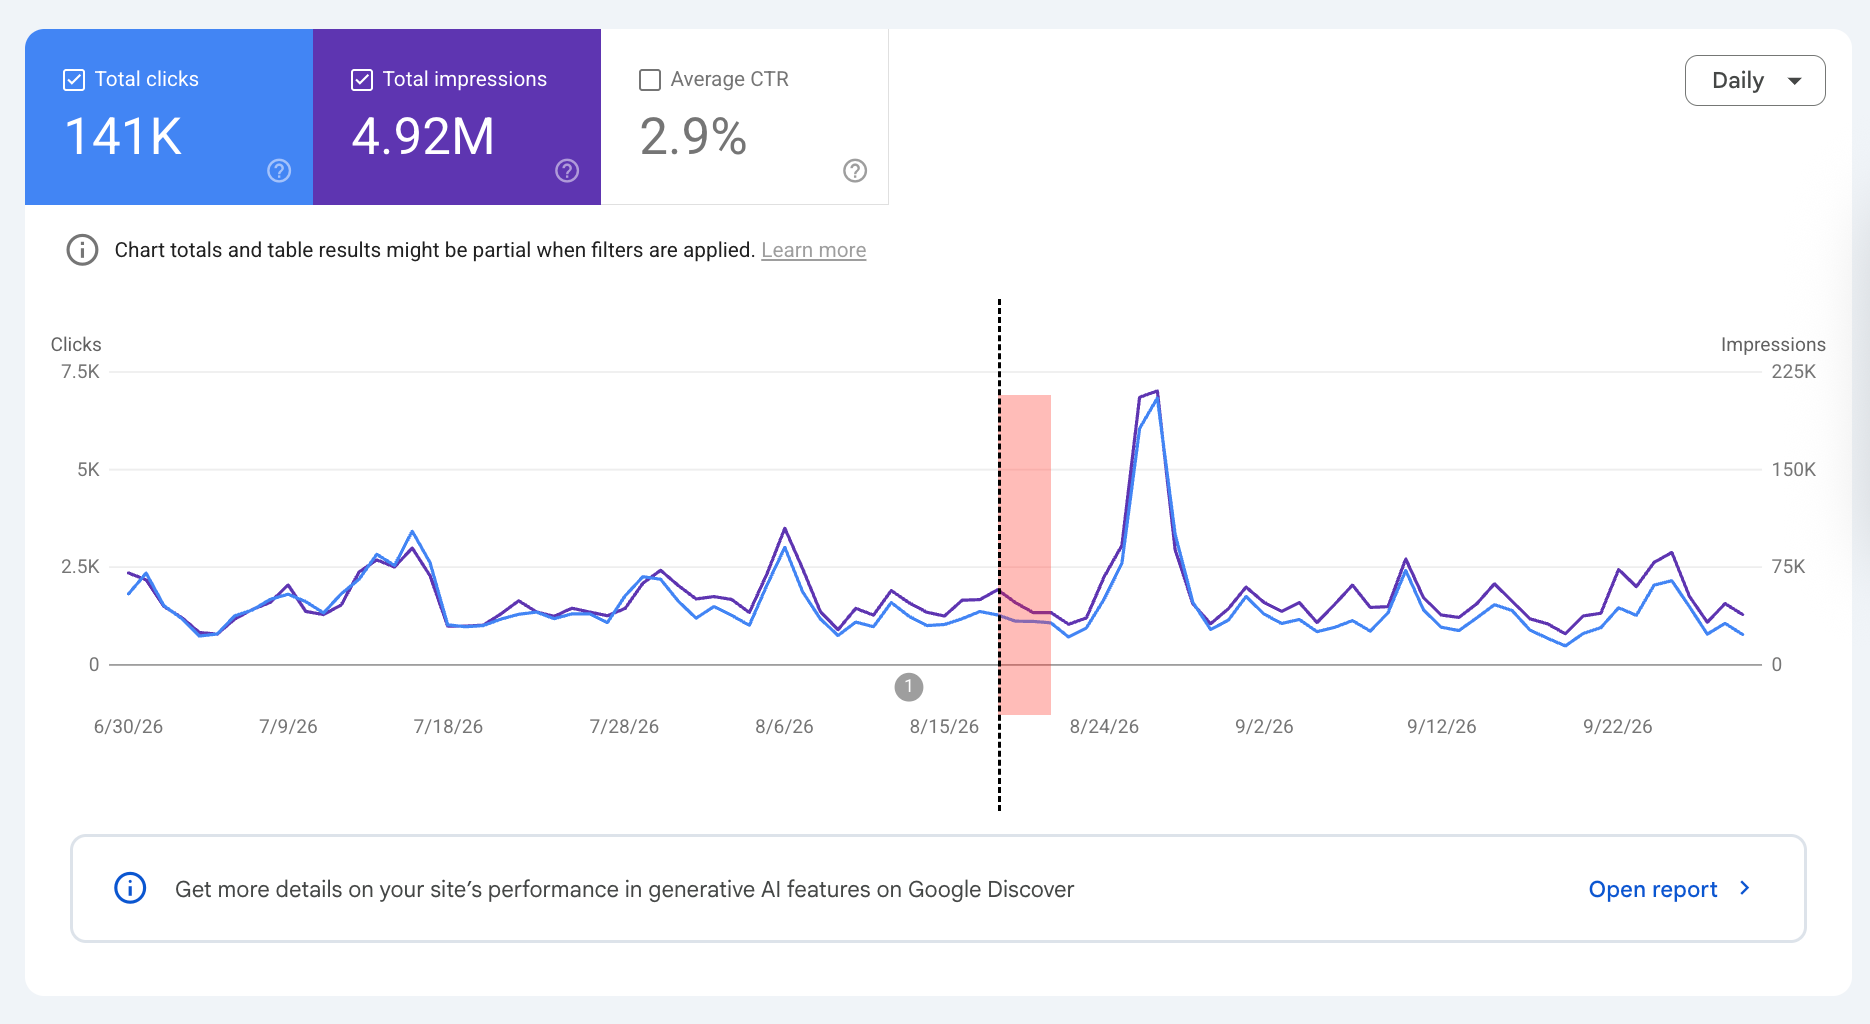
What AI data is available? Impressions. Like the Search report, Google only includes Generative AI Discover impressions.
What it can do: Discover is not driven by specific searches (it’s algorithmically curated); GSC reporting is relatively limited: date ranges and the comparison tooling can track performance over time. There’s no data about how or why your content is selected. Use the Page filter to see a subset of URLs with a specific string. Exporting this data to a spreadsheet allows for deeper analysis.
🔥 Pro tip: After importing the data into Google Sheets, you can pull in titles, meta descriptions or featured image URLs (using
IMPORTXMLor similar functions) to reveal content patterns. Are specific headline formats driving higher engagement? Which verticals or topic clusters consistently see above-average CTR?
Why it matters: Discover is sometimes thought of as a black box for publishers and is a notoriously volatile platform. Track performance on Discover to understand the topics, formats and angels that work best for your site.
Performance reports for social channels
What it is: Social media channels can be added to GSC as Properties, just like your site’s domain. This allows publishers to track how their social and video content (from platforms like Instagram, TikTok, X/Twitter or YouTube) performs across Google’s surfaces.
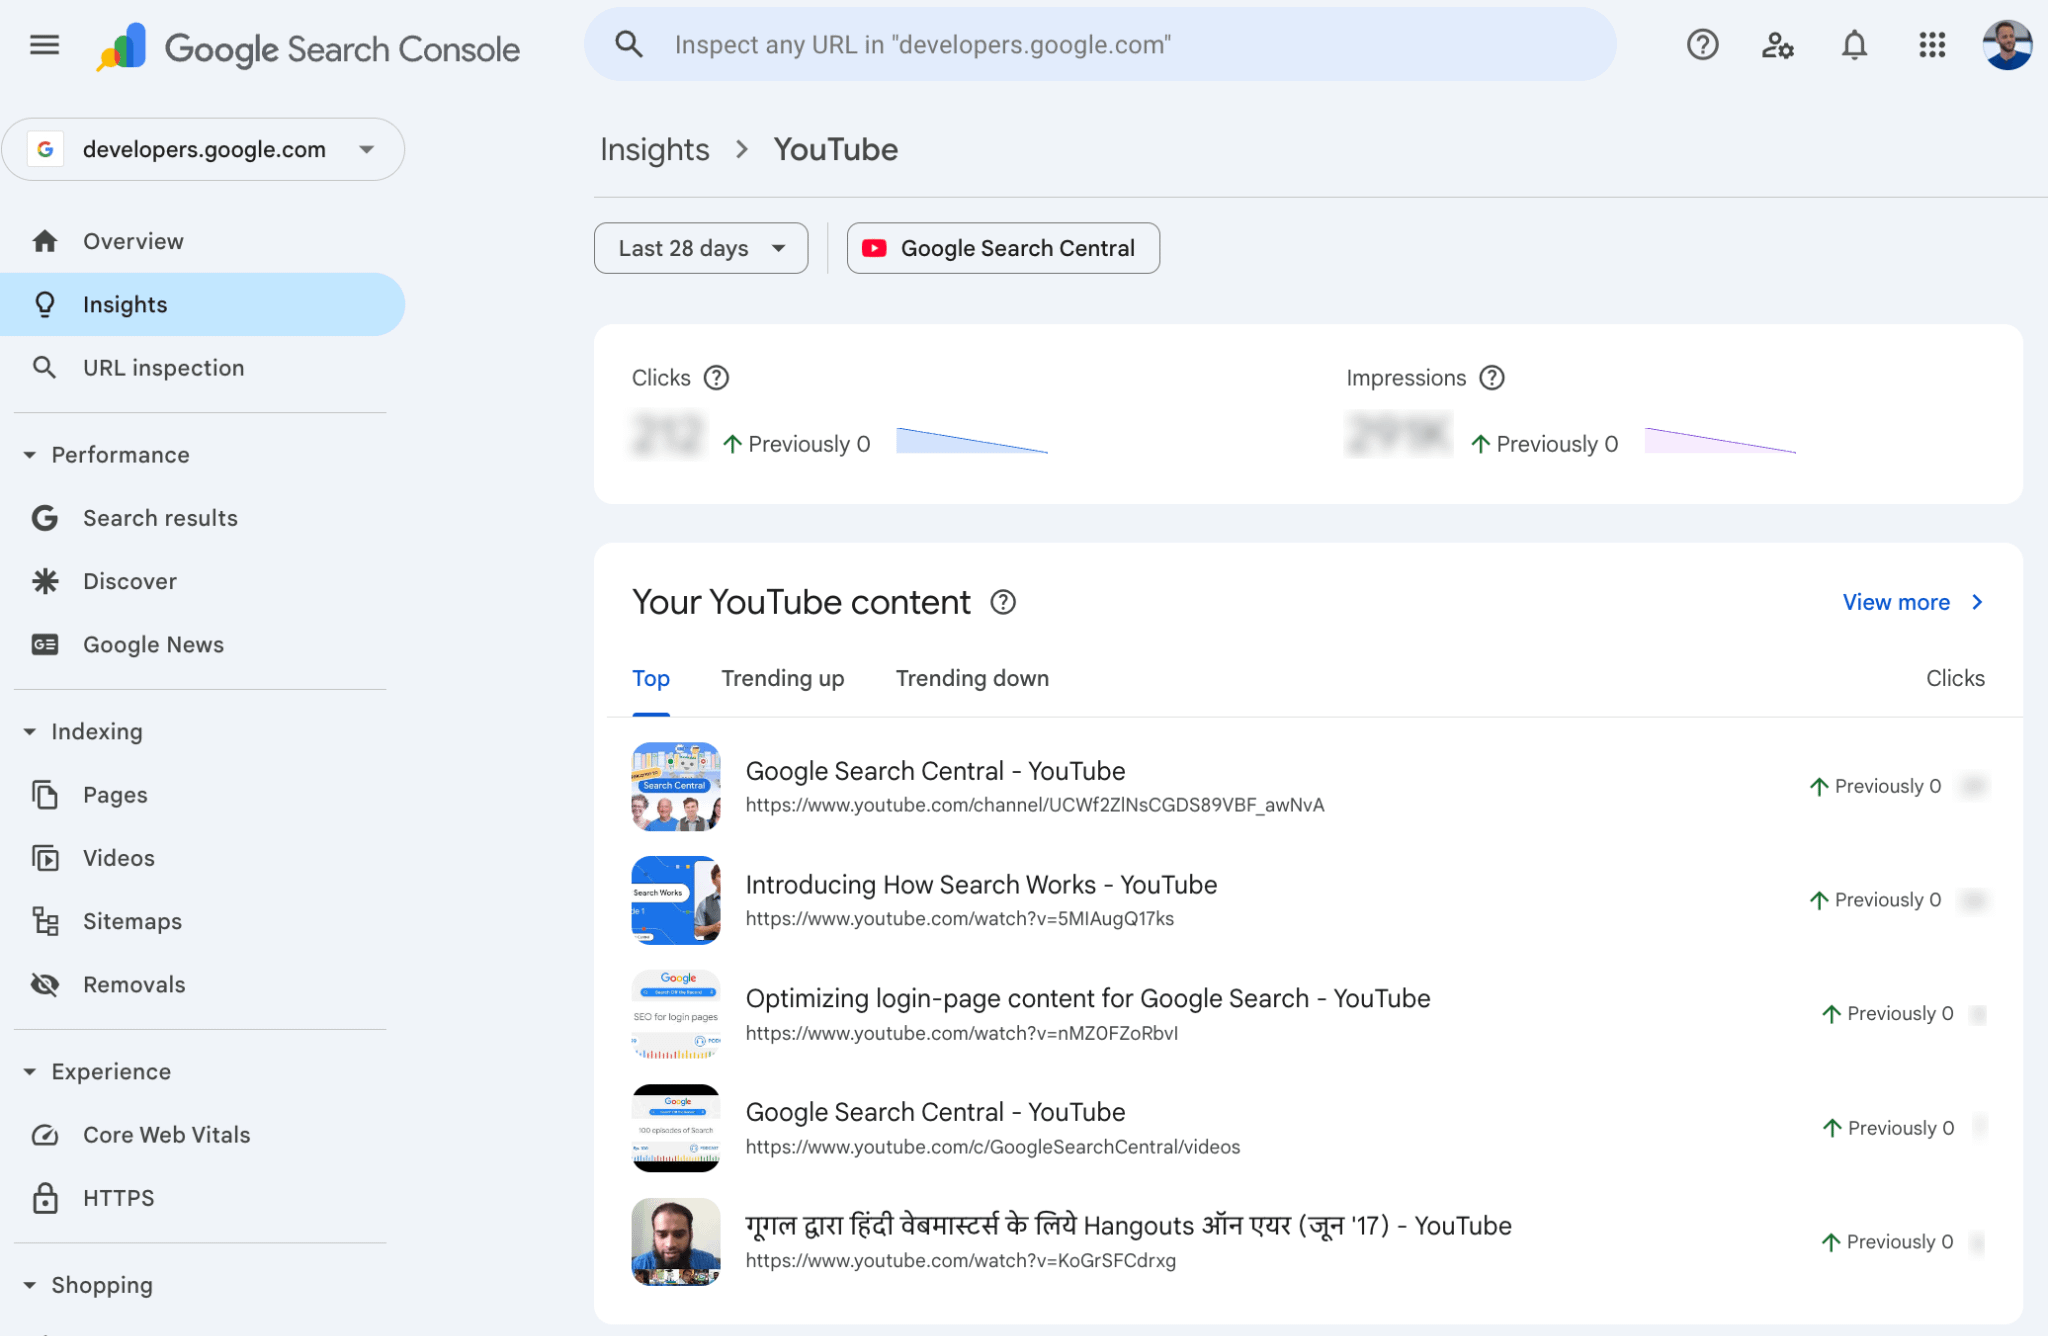
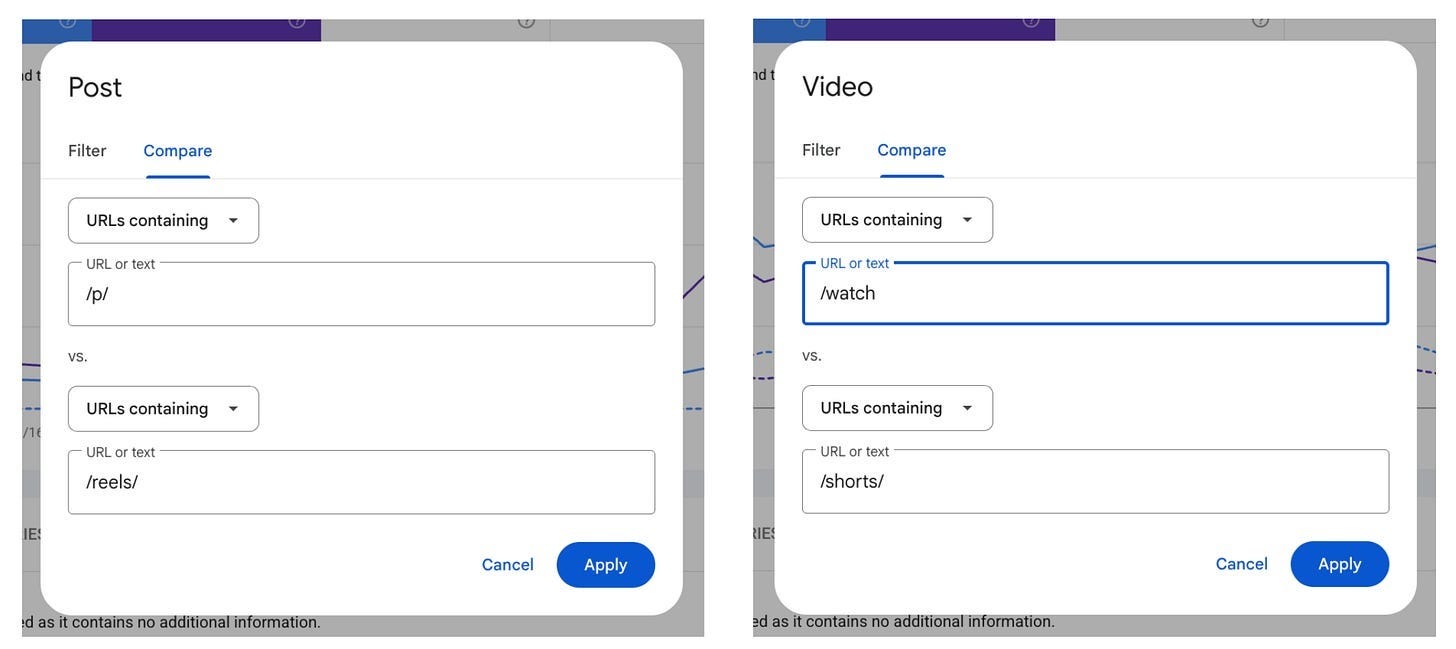
What it can do: Publishers can track traffic trends (e.g., if an older video suddenly pops off), identify top-performing content, see the search terms people use to find social content, compare formats (e.g., short vs. long-form YouTube video) and more.
The report provides insights for:
Traffic over time: How many clicks content garnered over 28 days, across different parts of Google.
Top-performing content: The posts or videos with the most engagement;
Top-referring queries: The terms people use to find your channel, or specific videos and posts.
Audience breakdown: Which region/countries your audience is in.
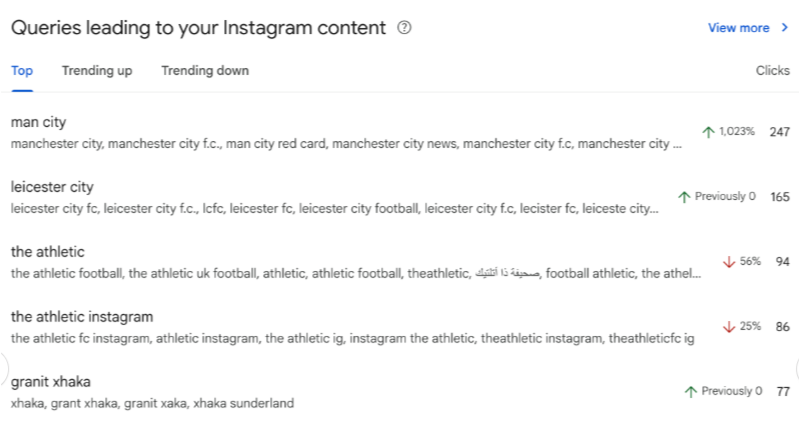
Why it matters: Google’s ecosystem is changing. It’s becoming more visual, more snackable and pulling from more places. This social media reporting allows publishers a more holistic view on how their brand appears across Google.
Opting out of generative AI
What it is: GSC now includes a section in settings for Search generative AI control. This manages your site’s inclusion in generative AI features on Google, including AI Overview, AI Mode and AI features on Discover.
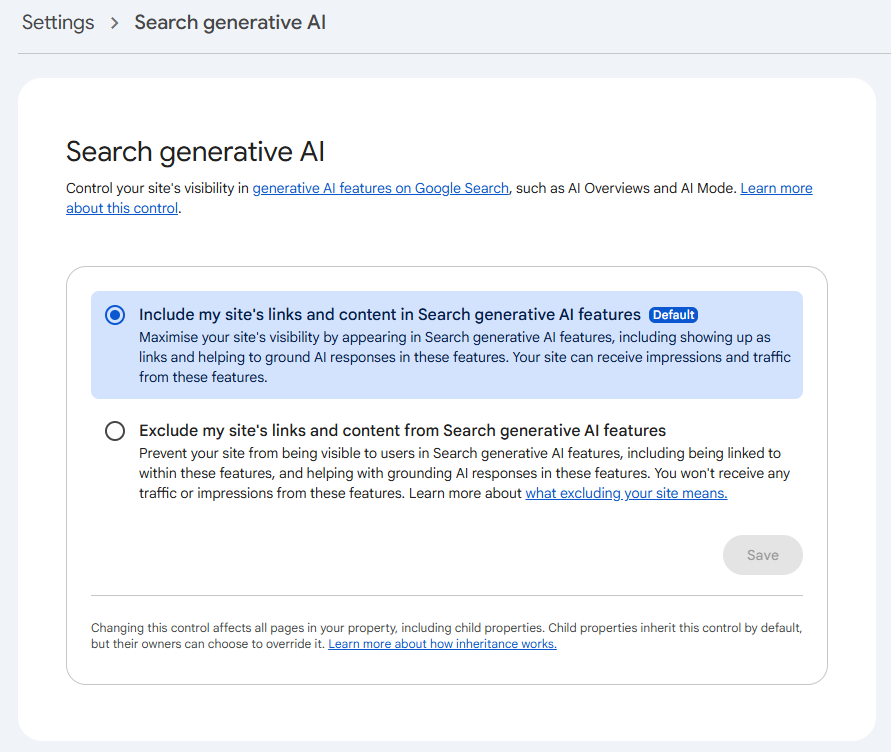
What it can do: Site owners can choose whether to include or exclude their site’s links and content in Search generative AI features. Opting in (the default) allows Google to include your site’s content in Search generative AI features, including as links and helping to ground the AI responses. (Google explains grounding as “the ability to connect model output to verifiable sources of information.” Opting out excludes all your site’s content — meaning no traffic or visibility from generative AI features.
Google says the opt out setting “isn’t used as a ranking or inclusion signal affecting other parts of Search,” but that a site’s content “may still be used to power Google Search as a whole.”
Sites can consider Google-Extended (to limit training of the models used in generative AI) or noindex (to completely block Google) to further limit Google’s access to your site.
Why it matters: Without click metrics, it remains a challenge for publishers to fully assess the risk and benefits of opting out of generative AI responses. It’s unclear how widely this will be adopted.
Technical reports in GSC
What it is: There are many technical reports available in GSC. As Barry Adams outlined in our fall community call, focus on reports with essential information about user experience, site speed, indexing and crawlability.
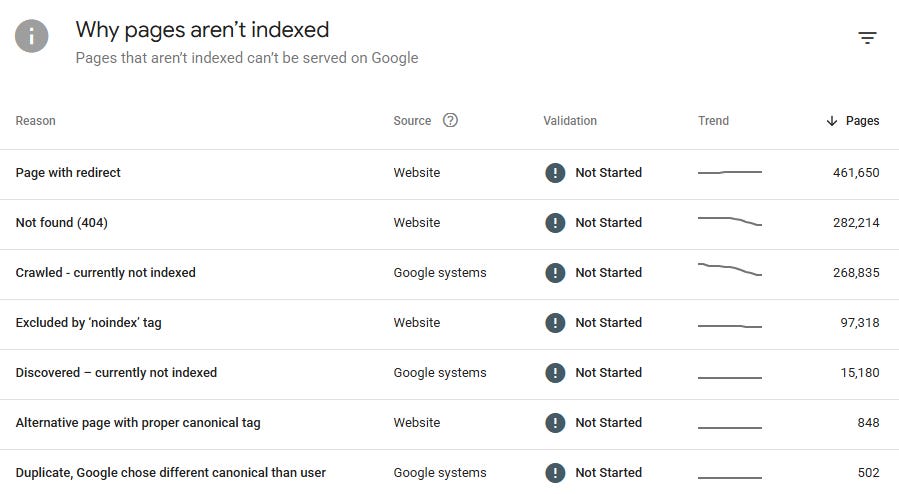
What it can do: Key reports in GSC reveal important technical health considerations for your site:
Core Web Vitals report: CWV are a minor ranking factor, but they do have a direct impact on the overall user experience of your site (a direct ranking factor and important for readers). Sites want to see mostly green (“good URLs”) in this reporting, but some yellow indicators (“URLs need improvement”) are normal.
Crawl stats report: How Google crawls your website. Average response time is a key metric to review, as it’s a measure of how fast your website responds to every request that Google bot. Google crawls based on time, not pages — so the faster the website, the more URLs Google can crawl in its limited budget. Google prefers 200 milliseconds or faster, but 600 seconds is generally acceptable.
Pages report: The index status of known URLs, with explanation of why Google chose not to index a page. Some things in this report matter (like “Crawled not indexed,” which reflects crawl waste or poor site quality), while other data (like “404 not found” since 404s are normal and don’t waste crawl budget) matters less.
Why it matters: The foundation of all good SEO is solid technical SEO. Sites that are easy to crawl and offer positive user experience will out-perform shoddy or slow sites.
The bottom line: GSC offers so much data. Given its limitations and caveats, consider the data more directional than precise. But, it is essential for understanding the topics, keywords and content formats that drive the most traffic for your site on Google.
#SPONSORED - The Classifieds

THE JOBS LIST
Audience or SEO jobs in journalism. Want to include a position for promotion? Email us.
Reuters is hiring a Global Audience Editor (London, U.K., hybrid).
The Times and Sunday Times is hiring a Newsletter Editor (London, U.K.).
The Globe and Mail is accepting applications for its 2027 Summer Jobs Program (Toronto, Canada).
The Economist is hiring a Head of Strategy for The Economist Pro (London, U.K.).
CNBC is hiring a Homepage and News Editor (New Jersey, hybrid).
American Public Media Group is hiring a Manager of Audience Analytics (St. Paul, Minnesota, hybrid).
The Wall Street Journal is hiring a Senior Analyst, Newsroom Data (New York, N.Y., full time).
RECOMMENDED READING
Google news and updates
Over the past few weeks, Google has updated a lot of its guidance to reflect generative AI content. Below is the chatter around those changes.
🤖 Google: Updated guidance on using generative AI content on your website.
🤖 Barry Schwartz: Google says to manually fact-check and review AI generated content for accuracy.
🤖 Google: Updated guidance on creating helpful, reliable, people-first content.
🤖 Barry Schwartz: Google updates helpful content document to include more on main content and effort, originality and talent.
🤖 Lily Ray: An algorithm update seems to be coming, targeting AI spam and non-helpful content.
Even more recommended reading
🌄 Ray Grieselhuber: AI Overviews on branded queries tripled in September 2026.
🟣 Roger Montti: Google Gemini adds UTM parameters for referral attribution.
💻 Estela Franco: How long does it take for Google to crawl, index and serve a webpage?
📰 Louisa Frahm and Gianluca Fiorelli: Creating news content that stands out in AI and multimodal search.
🍊 Aleyda Solis: Introducing SERP Squeeze Monday, looking at a query’s changes in Google. This week’s query: basketball shoes.
🔍 Rahul Sengupta: GEO citation analysis: What LLMs cite in Australia and why.
🔢 Francine Monahan: Identifying the right KPIs in the context of Search.
What did you think of this week’s newsletter?
(Click to leave feedback.)
Catch up: Last week’s newsletter


Have something you’d like us to discuss? Send us a note on LinkedIn (Jessie or Shelby) or email us (hello@seoforjournalism.com).
Written by Jessie Willms and Shelby Blackley